Underwater Vision Profiler 5 HD (UVP)
- PI
Andrew McDonnell (University of Alaska, Fairbanks)
- Cruise Participant
Stephanie O’Daly (Lead; University of Alaska, Fairbanks)
Ali Siddiqui (Secondary; Johns Hopkins University)
System Configuration and Sampling
The Underwater Vision Profiler 5 (UVP5) HD serial number 207 was programmed, mounted on the rosette, and charged. The UVP5 is outfitted with a High Definition 4 Mp camera with an acquisition frequency of up to 20 Hz. This optical imaging device obtains in situ concentrations and images of marine particles and plankton throughout the water column, capturing objects sized ~100 µm to several cm in diameter. The camera of the UVP5 HD is different from the previous non-HD version, but the operations are identical for both. The instrument and data processing are described in [Picheral2010]. Depth trigger mode was used throughout the entirety of the cruise, programmed to turn on at 15 m with a maximum depth of 6000 m. A 20 m soak for one minute was used throughout the cruise. The UVP turned on and off as expected for all cruise stations using this configuration.
General Particle Patterns
Near South America, we see low particle abundance overall with a strong surface and often present subsurface particle abundance maximum (Fig. 1). A deep nephloid layer generally was not present. Additionally, we observed a moderate mean particle size at all depths. Moving further north, but still south of the Gulf Stream, we see even lower particle abundance with a smaller mean particle size (Fig. 2). In the Gulf Stream, we see elevated particle abundance at the surface with a very strong deep nephloid layer signal at depth with a smaller mean particle size at all depths (Fig. 3). Stations north of the Gulf Stream were consistent with very high particle abundance at the surface with a slightly elevated particle abundance at depth indicating a slight deep nephloid layer signal at depth (Fig. 4). We saw a higher mean particle size at all depths in this region.
Future Data Analysis
Total image count gathered during the cruise was 628,260 images. A combination of machine learning and manual validation will be used to sort images using the Ecotaxa database. Images will be sorted into various zooplankton taxa and detrital categories. Zooplankton categories will include crustacea (including copepods and krill), gelatinous (larvacean, jellyfish, salps), and rhizaria. Examples of these images are shown in Fig. 5.
Problems
At the test station, the UVP turned on during the initial 20 m soak and sampled during the downcast. When the rosette was at 300m the cast was aborted to remove tubing from the pump. The UVP turned off during the up cast, as expected. The CTD was redeployed, but the UVP did not turn on during the 20 m soak and did not sample during the downcast. I believe the UVP needed to be on deck longer to allow the camera to fully turn off after the initial cast. We didn’t have to abort any other casts on this cruise, so I was not able to test this hypothesis. To be safe, in the future it would probably be best to unplug and re-plug the power shunt between casts after aborted casts.
Figures
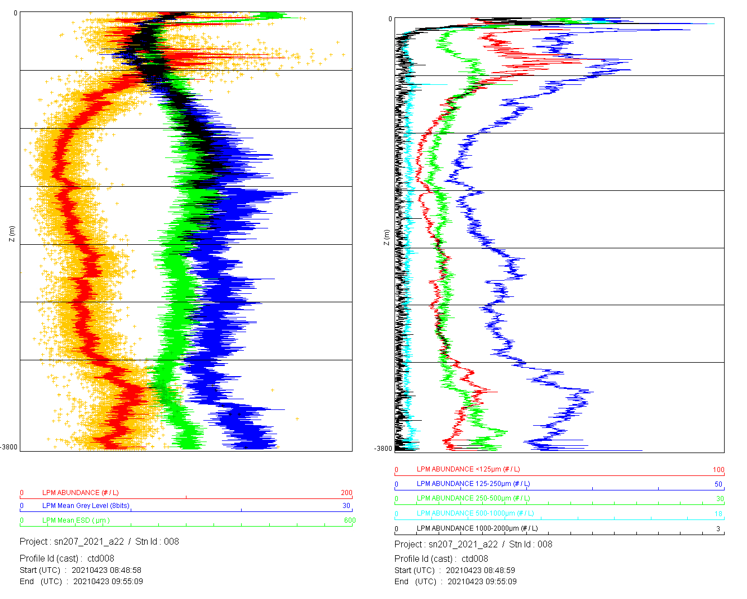
Examples of preliminary profiles at station 8. Plots show total large particulate matter (LPM) abundance, mean grey level (brightness) of LPM, and equivalent spherical diameter (ESD) (right) and particle concentration in size bins (left) both plotted against depth (meters). Near South America, we see low particle abundance overall with a surface and subsurface particle abundance maximum. A deep nephloid layer is not present and with there is a medium mean particle size at all depths.
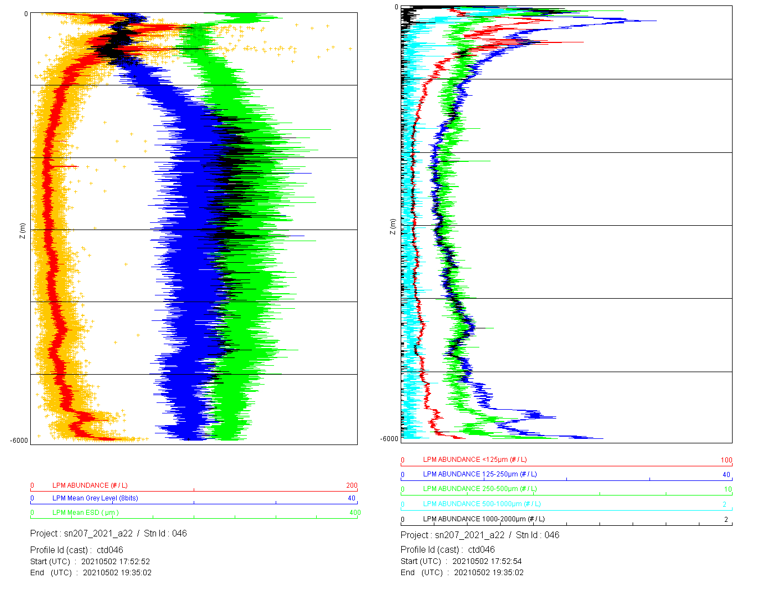
Examples of preliminary profiles at station 46. Plots show total large particulate matter (LPM) abundance, mean grey level (brightness) of LPM, and equivalent spherical diameter (ESD) (right) and particle concentration in size bins (left) both plotted against depth (meters). South of the Gulf Stream, we see low particle abundance with a smaller mean particle size.
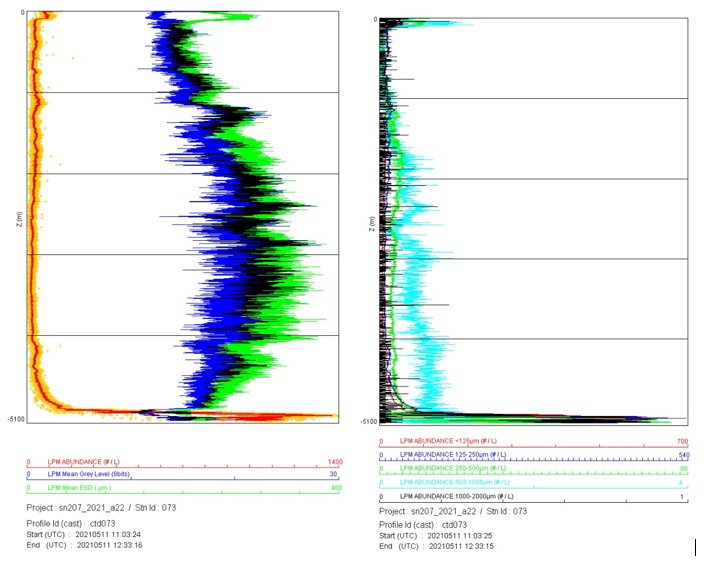
Examples of preliminary profiles at station 73. Plots show total large particulate matter (LPM) abundance, mean grey level (brightness) of LPM, and equivalent spherical diameter (ESD) (right) and particle concentration in size bins (left) both plotted against depth (meters). In the Gulf Stream, we see elevated particle abundance at the surface with a very strong deep nephloid layer signal at depth and a smaller mean particle size.
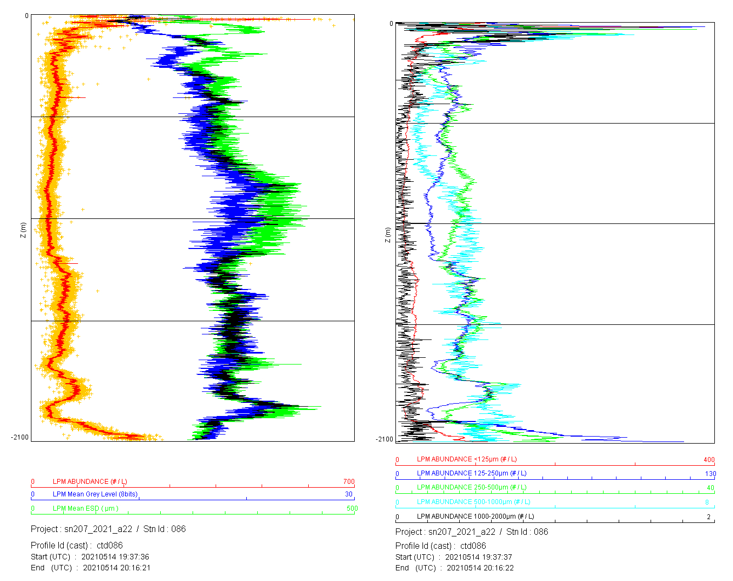
: Examples of preliminary profiles at station 86. Plots show total large particulate matter (LPM) abundance, mean grey level (brightness) of LPM, and equivalent spherical diameter (ESD) (right) and particle concentration in size bins (left) both plotted against depth (meters). North of the Gulf Stream, we see very high particle abundance at the surface with a slight deep nephloid layer signal at depth and a higher mean particle size.
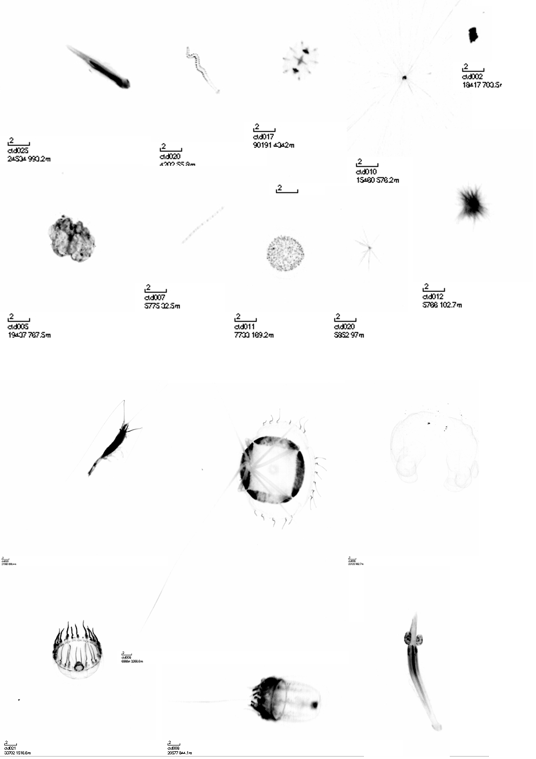
Examples of particle and plankton images captured by the UVP5HD and processed by custom software. The scale bar indicates 2 millimeters. Station number, image number for that cast, and depth at which the image was captured are also given in the image.
- Picheral2010
Picheral, M., Guidi, L., Stemmann, L., Karl, D.M., Iddaoud, G., Gorsky, G., 2010. The Underwater Vision Profiler 5: An advanced instrument for high spatial resolution studies of particle size spectra and zooplankton. Limnol. Ocean. Methods 8, 462–473.