Cruise Narrative
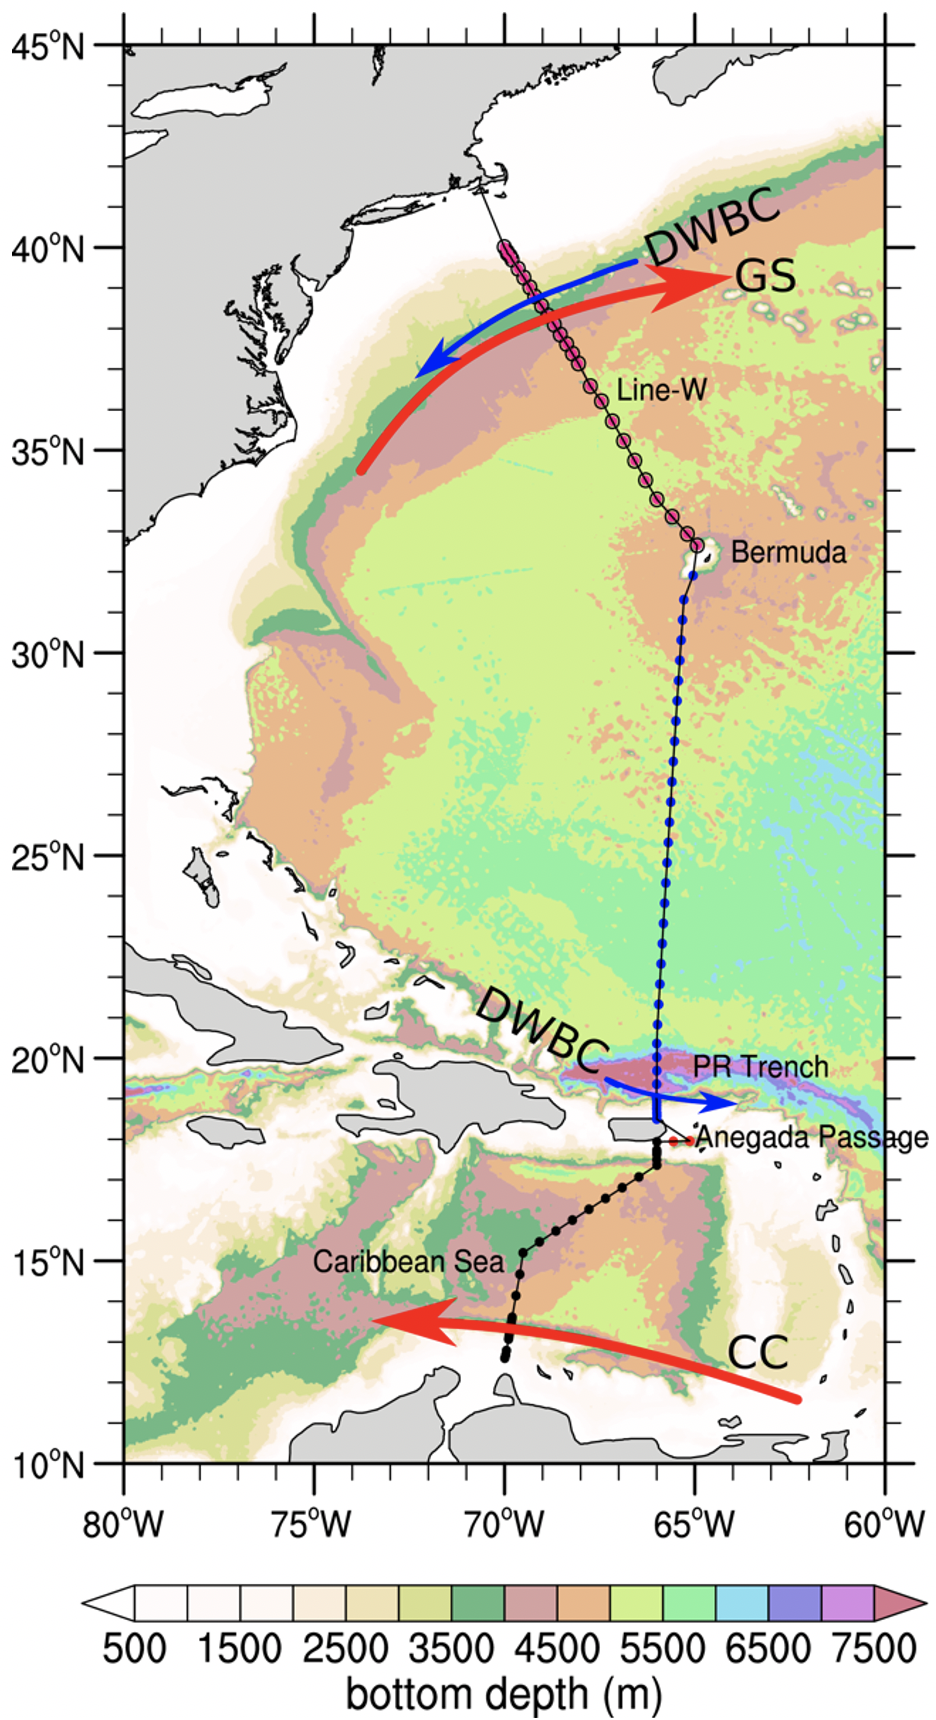
GO-SHIP A22 2021 occupation. Black dots are used for CTD/LADCP/rosette stations in the Caribbean Sea, red in the Anegada Passage, blue along 66W and pink following the Line-W. PR stands for Puerto Rico.
The A22 2021 occupation (Figure 1) followed the 2012 transect, except that nine stations were added in the region between the south of Puerto Rico and Bermuda. These additional stations made the nominal spacing for the 2021 occupation about 30 nm (50 km) in the open ocean. Like 2012, stations were more spaced (more than 40- nm) in two areas: around Puerto Rico and Bermuda because the sea is very shallow there (< 50 m). The initial cruise length (28-days) was planned so that there were two weather days if a weather system put CTD operations on hold. Previous occupations of this transect were impacted by weather systems. In 2012, a similar period (April-May) as 2021, a weather system delayed operation at the beginning of the cruise. As explained below, the weather was not a problem in 2021; all 90 planned stations were successfully occupied, with the full suite of core GO-SHIP chemical and physical parameters measured from the sea surface to 10 m above the seafloor (as described in the following sections). The A22 2021 cruise had a total duration of 27 days.
In contrast to 2012, the A22 started at its most equatorial position (12.6N-70W) and ran northward. We departed from St. Thomas (18.3N-64.9W), US Virgin Island, on April 20 and arrived in Woods Hole (41.5N-70.7W), Massachusetts, on May 16, a day earlier than initially predicted due to excellent weather and a faster transit speed than anticipated (sustained 13 knots). The A22 was occupied immediately after the A20 (~52W), which started in Woods Hole, Massachusetts, and worked towards St. Thomas.
Because of the COVID-19 pandemics, we had fewer participants during the A20/A22 journey, each leg with a science party of twenty-five members. The smaller science party decreased our ability to take level-3 measurements in these legs compared with previous (pre-COVID) GO-SHIP cruises. More than half (14 members) participated on both cruises totalizing more than 2-months at sea.
As part of the COVID-19 protocol, all members had to self-isolate in a facility for two weeks, take several COVID tests, measure body temperature twice a day (recording them online), and wear face masks. Twelve people observed isolation in St. Thomas, including the chief and co-chief scientists for the A22. One of the members broke the COVID protocol by walking outside the isolation property without a mask and could not come on board. In total, each member isolating at St. Thomas took 4 to 5 tests: before traveling to St. Thomas (1-2), at St. Thomas (2), and before board the ship (1). All 11 members were negative for COVID-19 and allowed to board R/V Thompson. During the first two weeks of the cruise, all participants wore masks outside their staterooms, kept social distance (only two people per table were allowed during meal times), and continued to monitor their body temperature through the cruise. With this strict protocol being followed by all, no COVID case was registered in both A20 and A22.
The R/V Thompson departed from St. Thomas, US Virgin Island on April 20, 08:00 AST. The transit to the first station near South America was short (about 1.75 days). While in transit, early on April 21, the first Core Argo float (~15.27N-69.06W) was deployed. A test station was done in international waters (4700 m deep) to train the CTD watch-standers and incoming lab technicians. For the test station, noon time was chosen so both watches could participate it. The first cast had to be aborted as a cap was not removed. This was the only time during the A22 that a cast was aborted. The package was redeployed after bringing it back to the deck to remove the cap. Later, it was determined that the UVP did not restart on the redeployment, but the decision was made to continue with the cast. No further incident with UVP happened for the entire cruise. During the test station, the CTD watch-standers learned from the ODF technicians how to prepare the rosette, fill in the logs, make a bottom approach, and fire the bottles. It was a slow cast as everybody was learning, and mistakes were being corrected. All 36 bottles were fired, giving the CTD watch-standers as much experience as possible before beginning the first part of the A22 line where stations were close together (< 10 nm in the Caribbean Current).
We arrived at the first station in the early hours of April 22. Throughout the next 24-hours, 7 stations were occupied in the Caribbean Current. The next day, we slowed the pace between stations (even waiting on), from 2h to 2.5h, to give more time for equipment charging (LADCP and UVP) and lab analysis. This procedure was adopted throughout the cruise. In every segment with stations closer than 20 nm, the time between casts was set to 2.5 or 3h depending on whether it was a half/full carbon station. This allowed the labs to take and analyze samples as much as possible, resulting in more complete datasets. Full carbon stations mean that carbon parameters samples are taken from all Niskin bottles. On partial stations (depending on how backed-up analysis is), samples are collected from about half bottles. Bottles on partial stations were selected to capture good vertical resolution. Most skipped bottles were in deep waters where DIC change is much smaller than in upper layers. At the 2021 A22 occupation, even stations were full carbon, and odds partial.
Time for lab analysis is an important parameter that should be considered in future GO-SHIP cruise planning. One thing that worked well was always keeping the labs informed about the time of arrival at stations for the next two/three days ahead. This helped the techs to plan the sampling better, as many of them have expressed. For estimating the time of arrival at stations, we used the Matlab routines from Alison Macdonald (WHOI), who kindly shared with us. We adapted the routines to the A22 specificities– everything worked well and avoid sample analysis falling behind schedule.
The weather was good, and the sea was flat most of the time during the 2021 occupation, except by a single day (May 10, 2021). Typically, winds were around 10 to 15 m/s along the A22 (Figure 2). The only time the winds peaked above 35 m/s was on May 10, when CTD operation was put on hold for almost a day during station #73. This was the single weather day for all cruise. Thanks to the weather forecast, we knew well in advance that the ship would face strong winds and high waves.
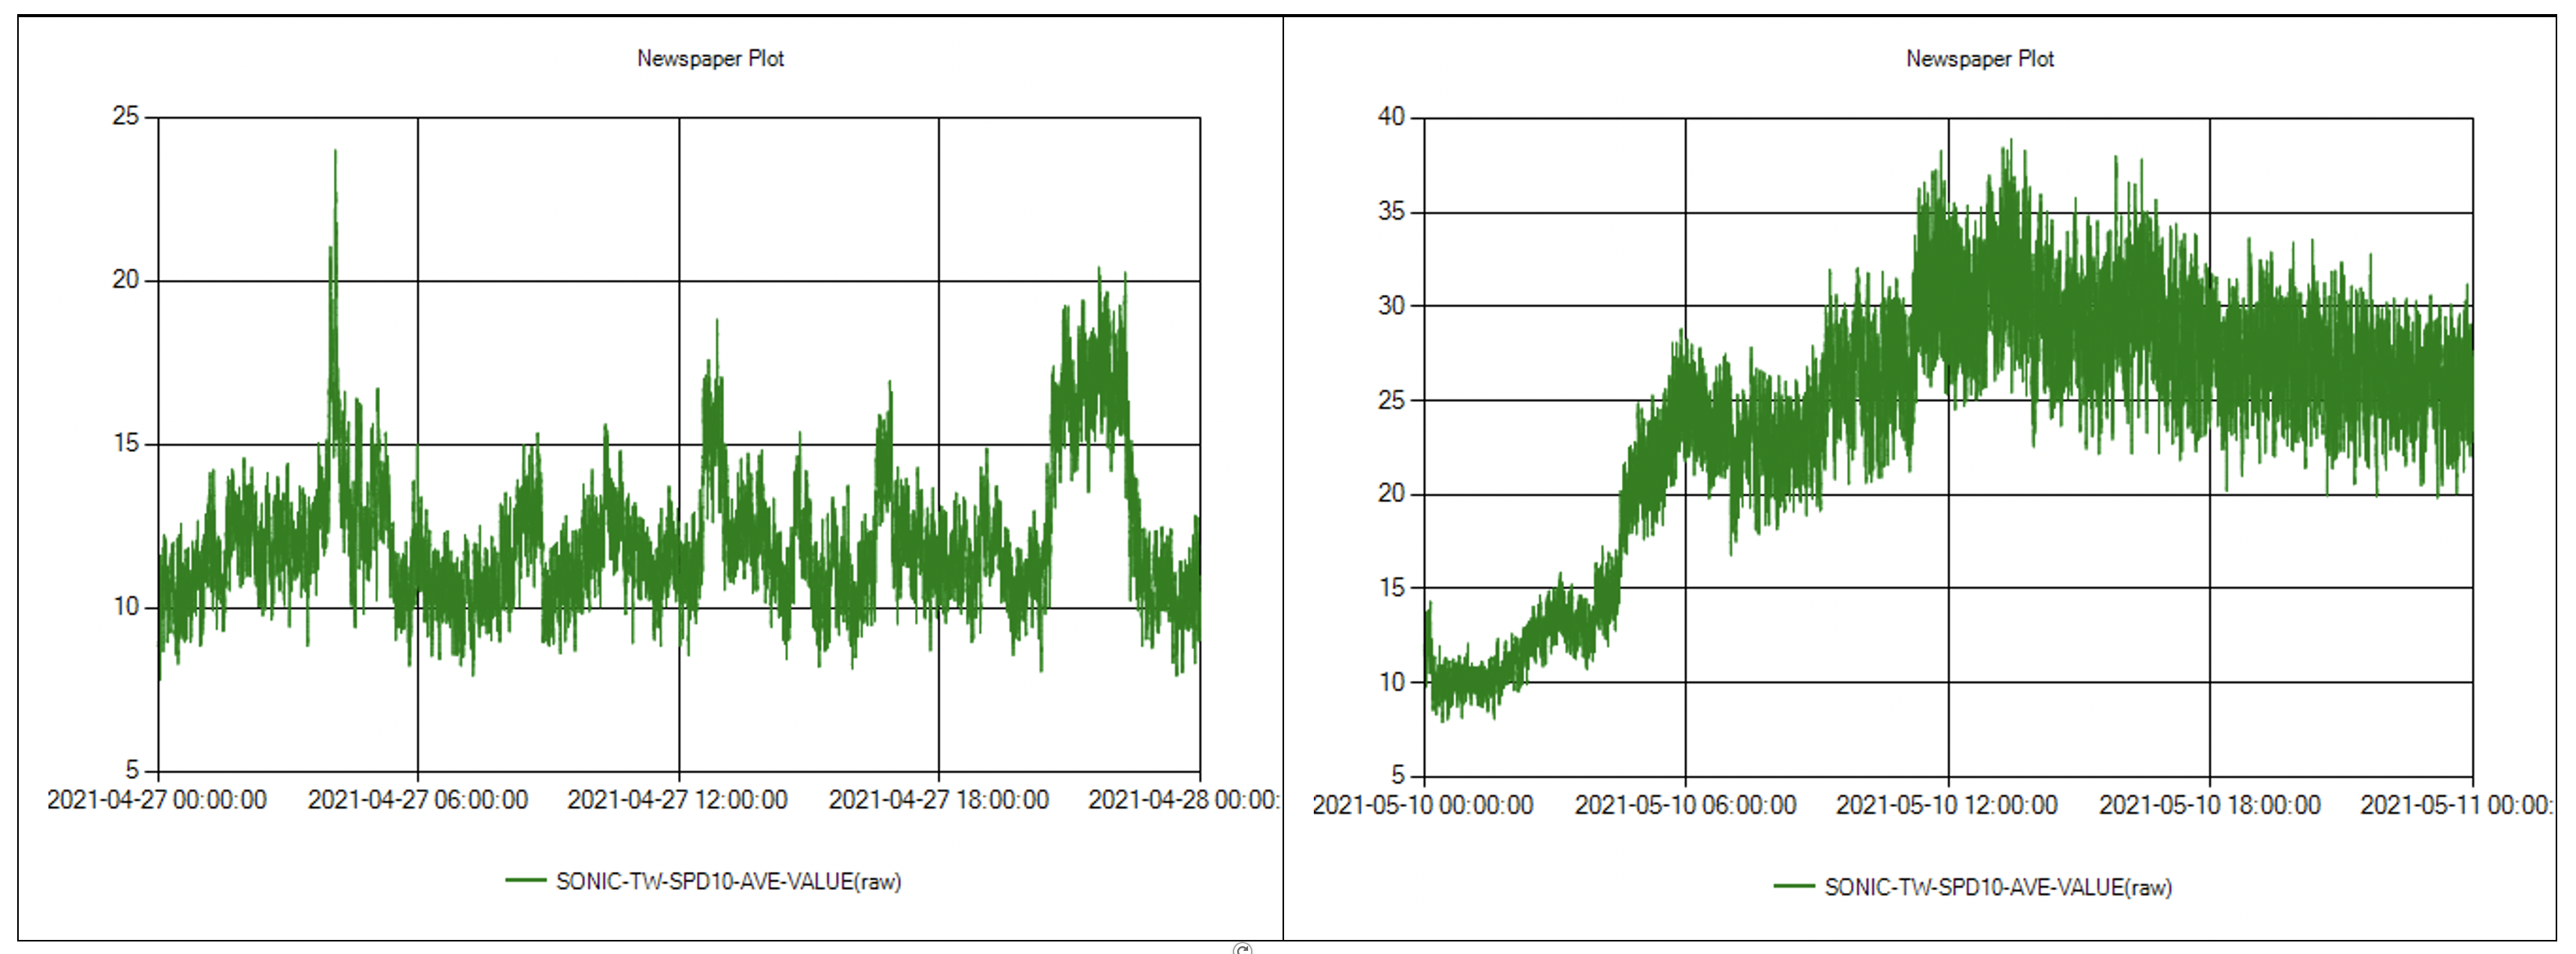
Real-time winds during the GO-SHIP A22 2021 occupation. Left is a typical day with wind strength varying from 10-20 m/s. Right is the winds for May 10 when the CTD operations were put on hold.
The good weather and flat sea made CTD deployments straightforward during the 2021 occupation (Figure 3). Only minor issues happened as documented later in this report: few unfired bottles, a broken O-ring, a missed target depth, wrong numbers in the sample log, and LADCP cable connections. These issues were sporadic and immediately fixed. Besides these minor issues, two mild injuries happened during rosette preparation, which led us to double our attention as a precaution. The injuries were a slight concern through the cruise, although everybody was well.
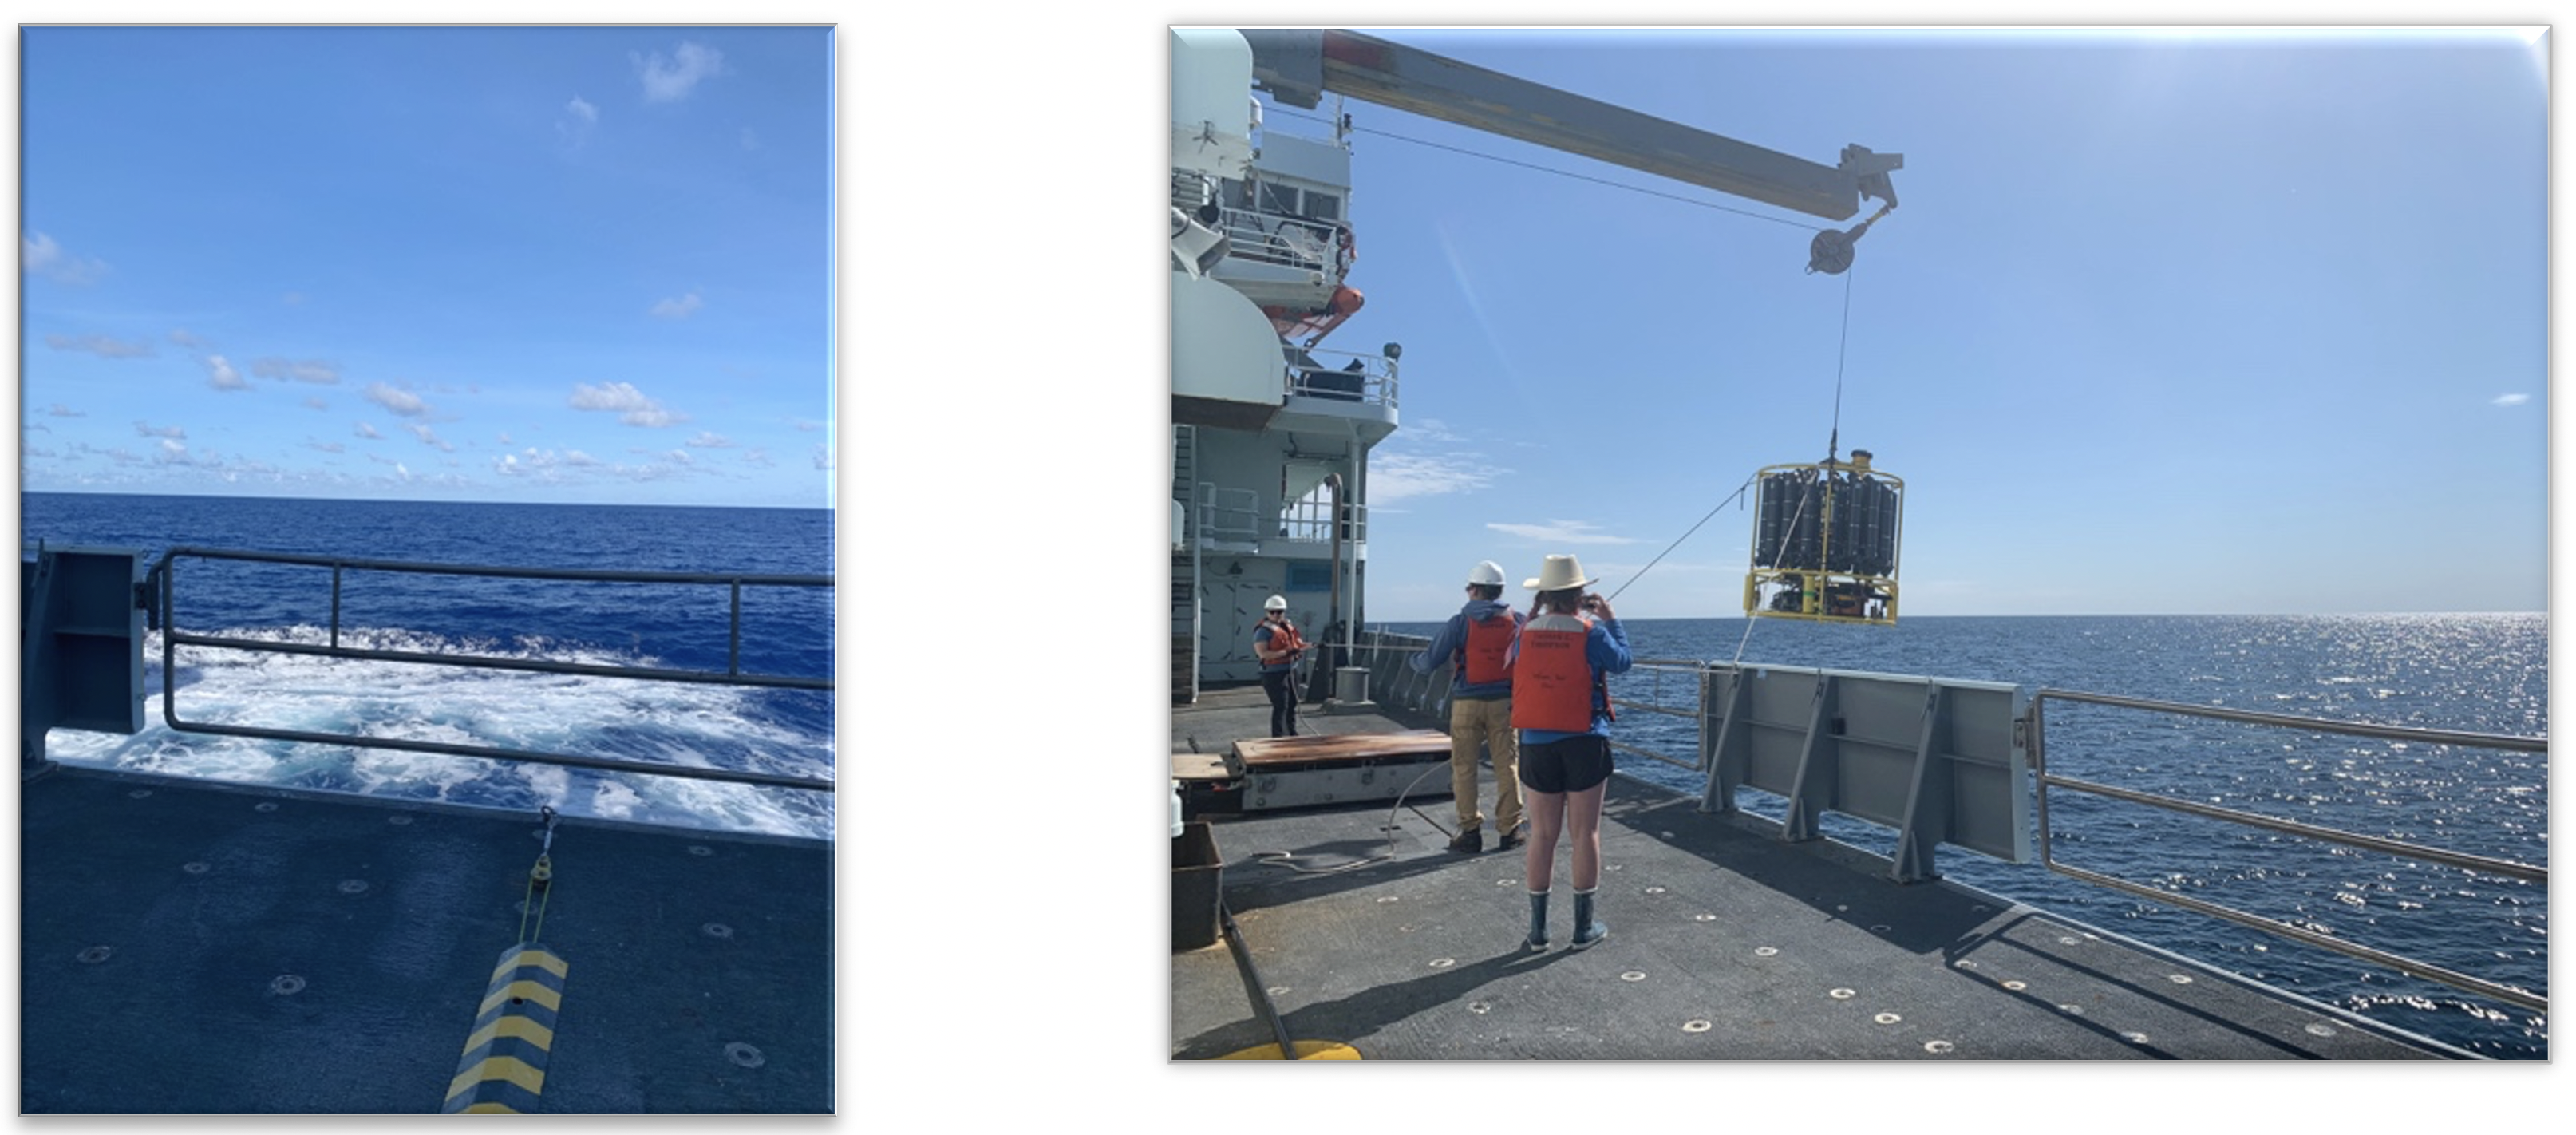
Flat sea and fair winds during GO-SHIP A22 2021 occupation. Left on May 3 and Right on May 15.
All 16 floats and 19 spotter buoys were deployed after stations with a ship speed of a few knots. All of them were successfully deployed by the CTD watchstanders and R/V Thompson marine technicians, as later described. For the Go-BGC floats, the deployments were chosen to match full carbon stations. This decision was taken to avoid disrupting the vertical sampling scheme of carbon parameters and at the same time to have enough depths between the surface and 2000 m to compare with these floats.
Sargassum samples, a piggy-back project during the A22 2021, were also collected when stations were in the US EEZ (exclusive economic zone) or international waters. This work was conducted by the ABs coordinated by the chief-mate.
Principal Finding and Features
The A22 transect occupied the western North Atlantic, extending from South America to the continental shelf of the Cape Cod. Along the way, it crossed main water masses of the North Atlantic (Figure 4): a strong signal of Antarctic Intermediate Water (AAIW) at the Caribbean Sea, a vestige of Antarctic Bottom Water (AABW) north of Puerto Rico ( = 28.162 kg/m3), the salty Subtropical Underwater (STUW) from the Caribbean Sea to 23-25ºN, several types of North Atlantic Deep Water (NADW) north of 30ºN and mixed waters of the Slope Sea, north of the Gulf Stream.
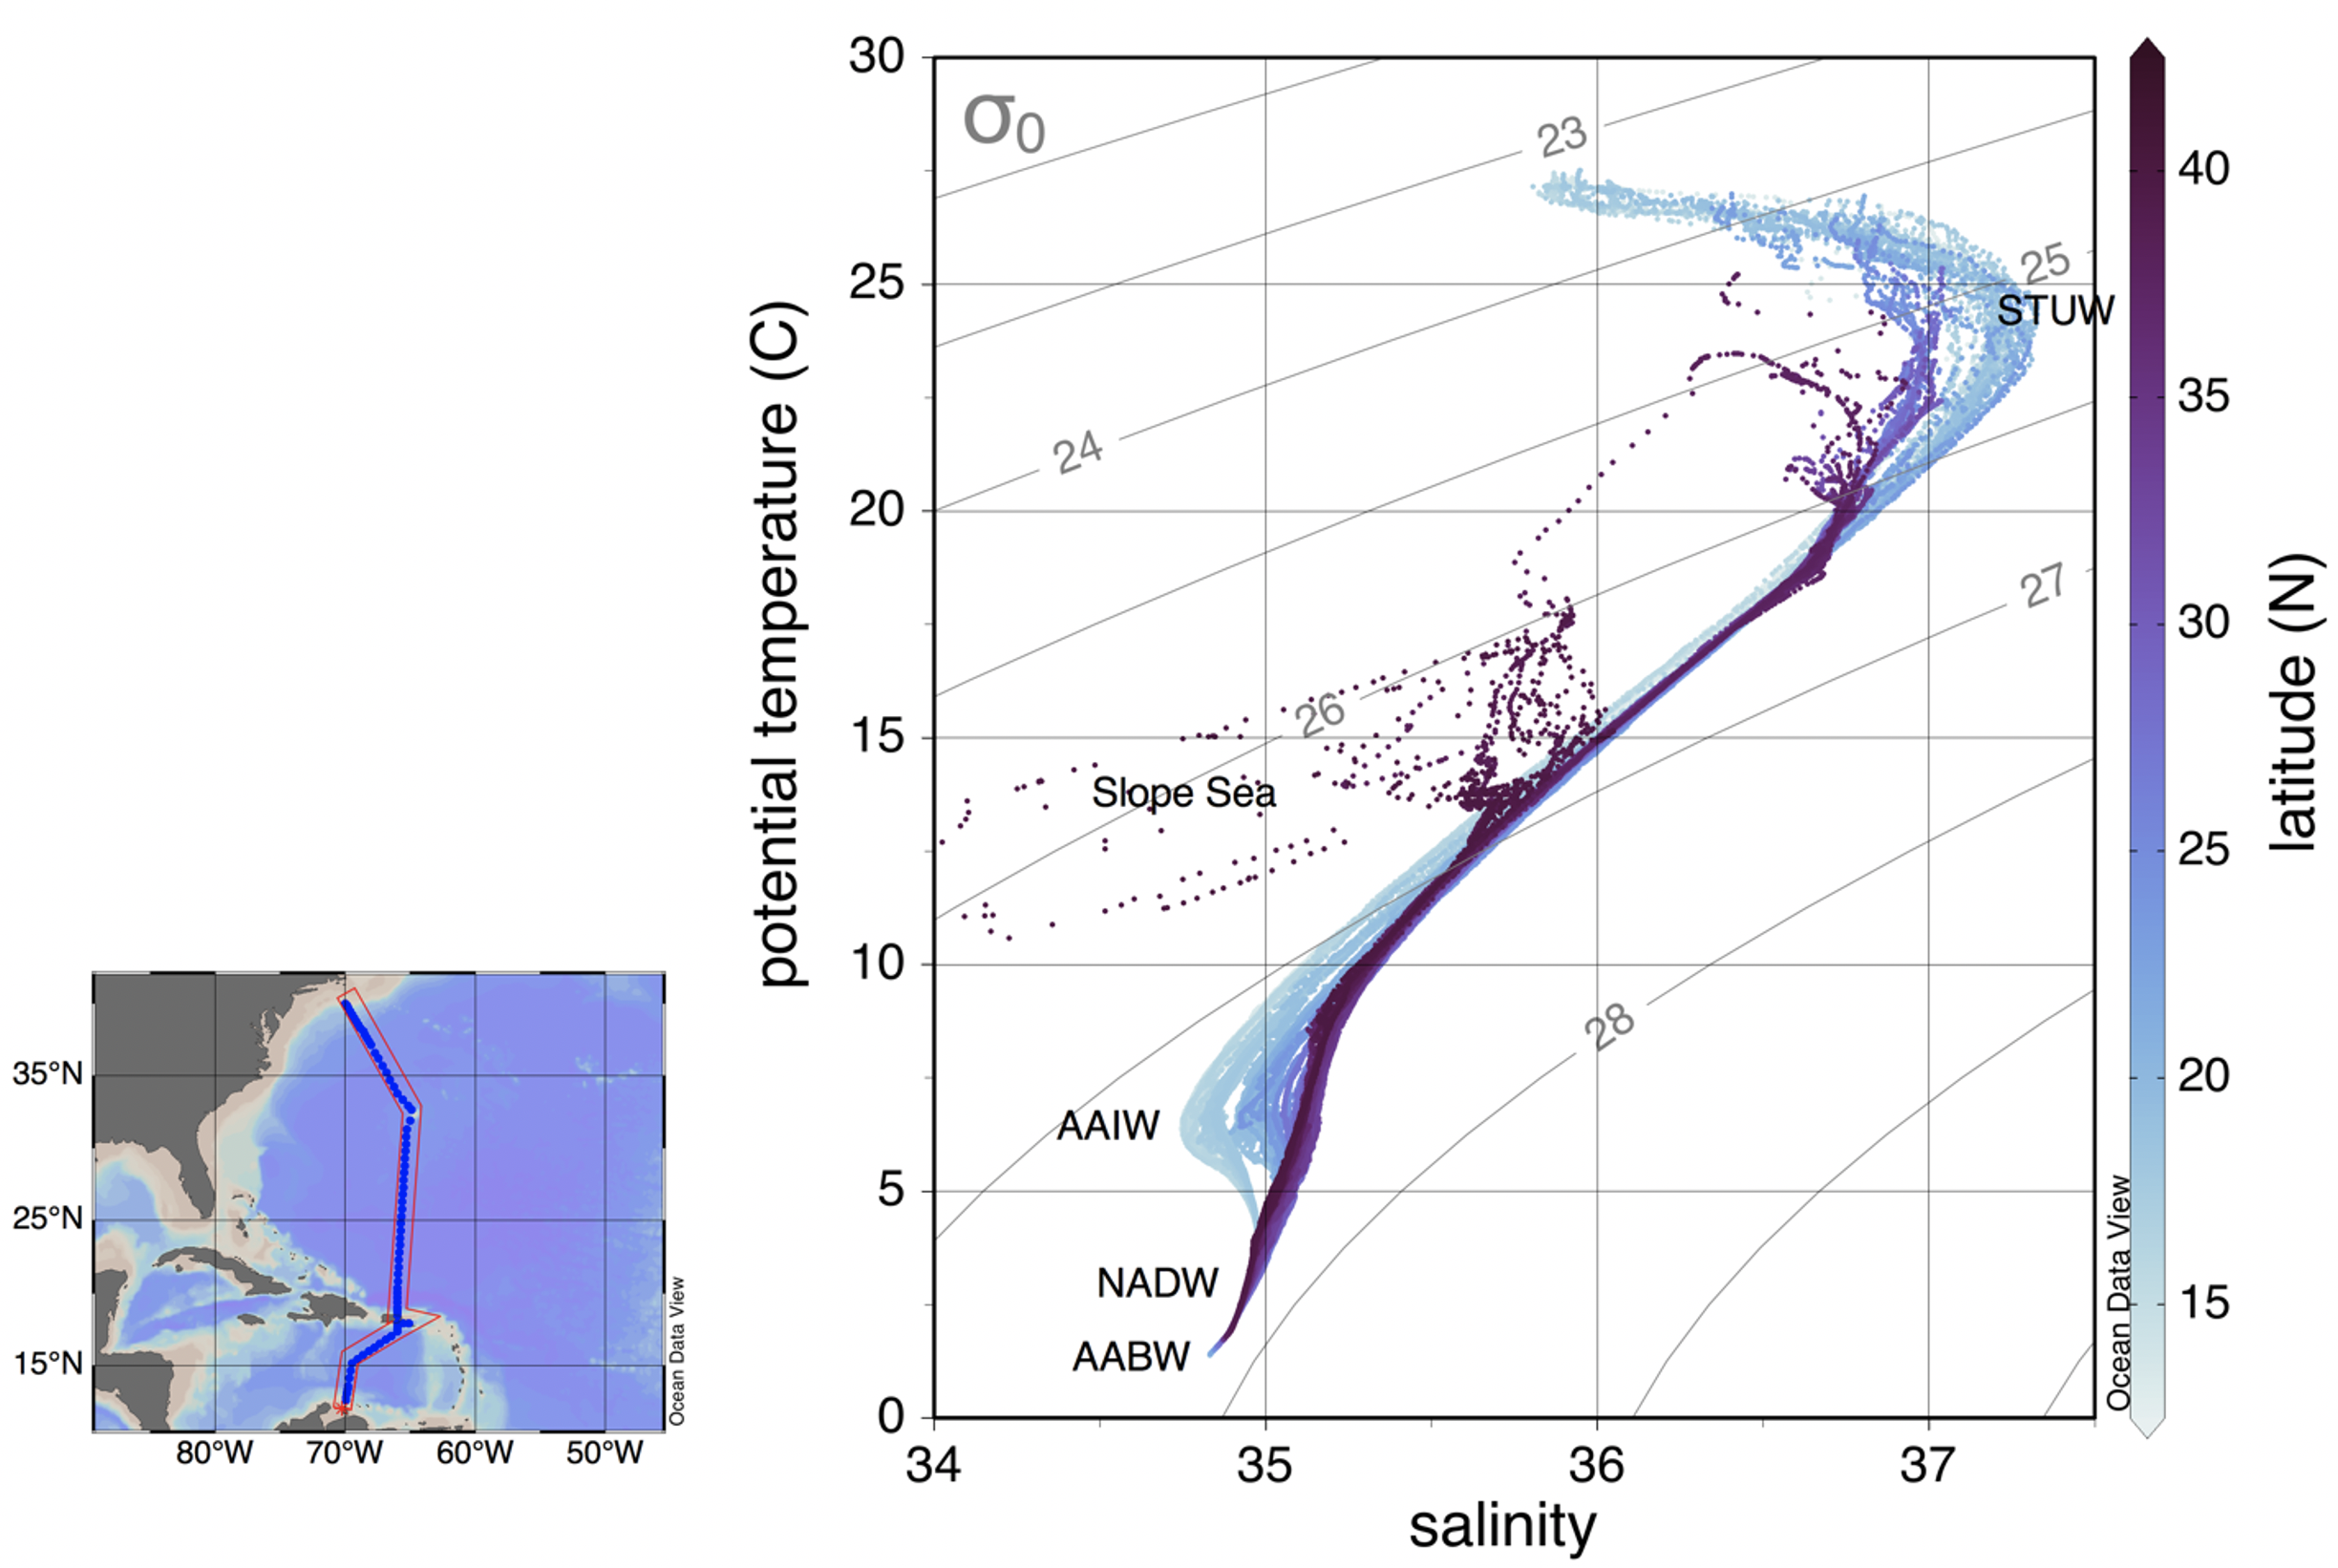
Temperature-Salinity diagram for the A22 2021 occupation. Color shows the latitude and contours potential density anomaly (kg/m3). Map displays the A22 transect in the western North Atlantic. Water mass classification based on neutral density () as defined by Joyce et al. (2001)
In the Caribbean Sea, the water mass distribution was similar to the previous occupations. No significant change in properties in the deep ocean was observed compared to 2012 (Figure 5). But, there was slight warming and salinification over the entire basin at those depths. Between 100-300 m, the saline STUW (with salinity > 37) was easily spotted in all stations in the Caribbean (Figure 6). The STUW continued to be spotted north of Puerto Rico until 25ºN (Figure 6, upper panel).
The fingerprint of AAIW (low salinity and low oxygen in the North Atlantic) was also present between 600-1000 m in the Caribbean (Figure 6). The AAIW enters the Caribbean basin through the Anegada Passage. Two stations were realized there during 2021, instead of one as in 2012. In both stations, there was a clear AAIW signal. As in 2012, the AAIW signature was intensified near South America, and its signature faded outside the Caribbean.
Like 2012, the water column was well mixed and weakly stratified in the Caribbean Sea below 2000 m (Figure 6). No strong density front or mesoscale eddies could be identified in the density field at the upper layer. Between 1500-2500, slightly slanted isopycnals were noticeable near Puerto Rico (Figure 6, lower left panel), probably associated with the Caribbean deep cyclonic gyre described by [Joyce2001] based on the 1997 A22 occupation.
The thermohaline front associated with the Gulf Stream was apparent at the end of the section (Figure 6). The Gulf Stream was particularly strong, with speeds measured by the shipboard ADCP of about 2.2 m/s in its core. Concurrent altimetry measurements (Figure 7) slightly underestimated it, with a maximum speed of 1.7 m/s.
Compared with 2012, cooling in the deep ocean was observed north of Puerto Rico, where the DWBC passes (Figure 5).
This was accompanied by a slight freshening.
Below 4500, where a vestige of AABW was detected, the cooling seems to be intensified.
As a result, there was an uplift of = 28.15 by about 200 m in the water column.
CFCs measurements (not shown) also suggest changes north of Puerto Rico.
In 2012, it was found an eddy with unusual water properties, near 21.5°N, just north of the Puerto Rico Trench.
The property anomalies - high oxygen and CFCs, low salinity, and nutrients – were particularly strong between 1000-1500 meters depth.
It was suggested that this eddy originated to the east of Newfoundland.
In 2021, the eddy was not present.
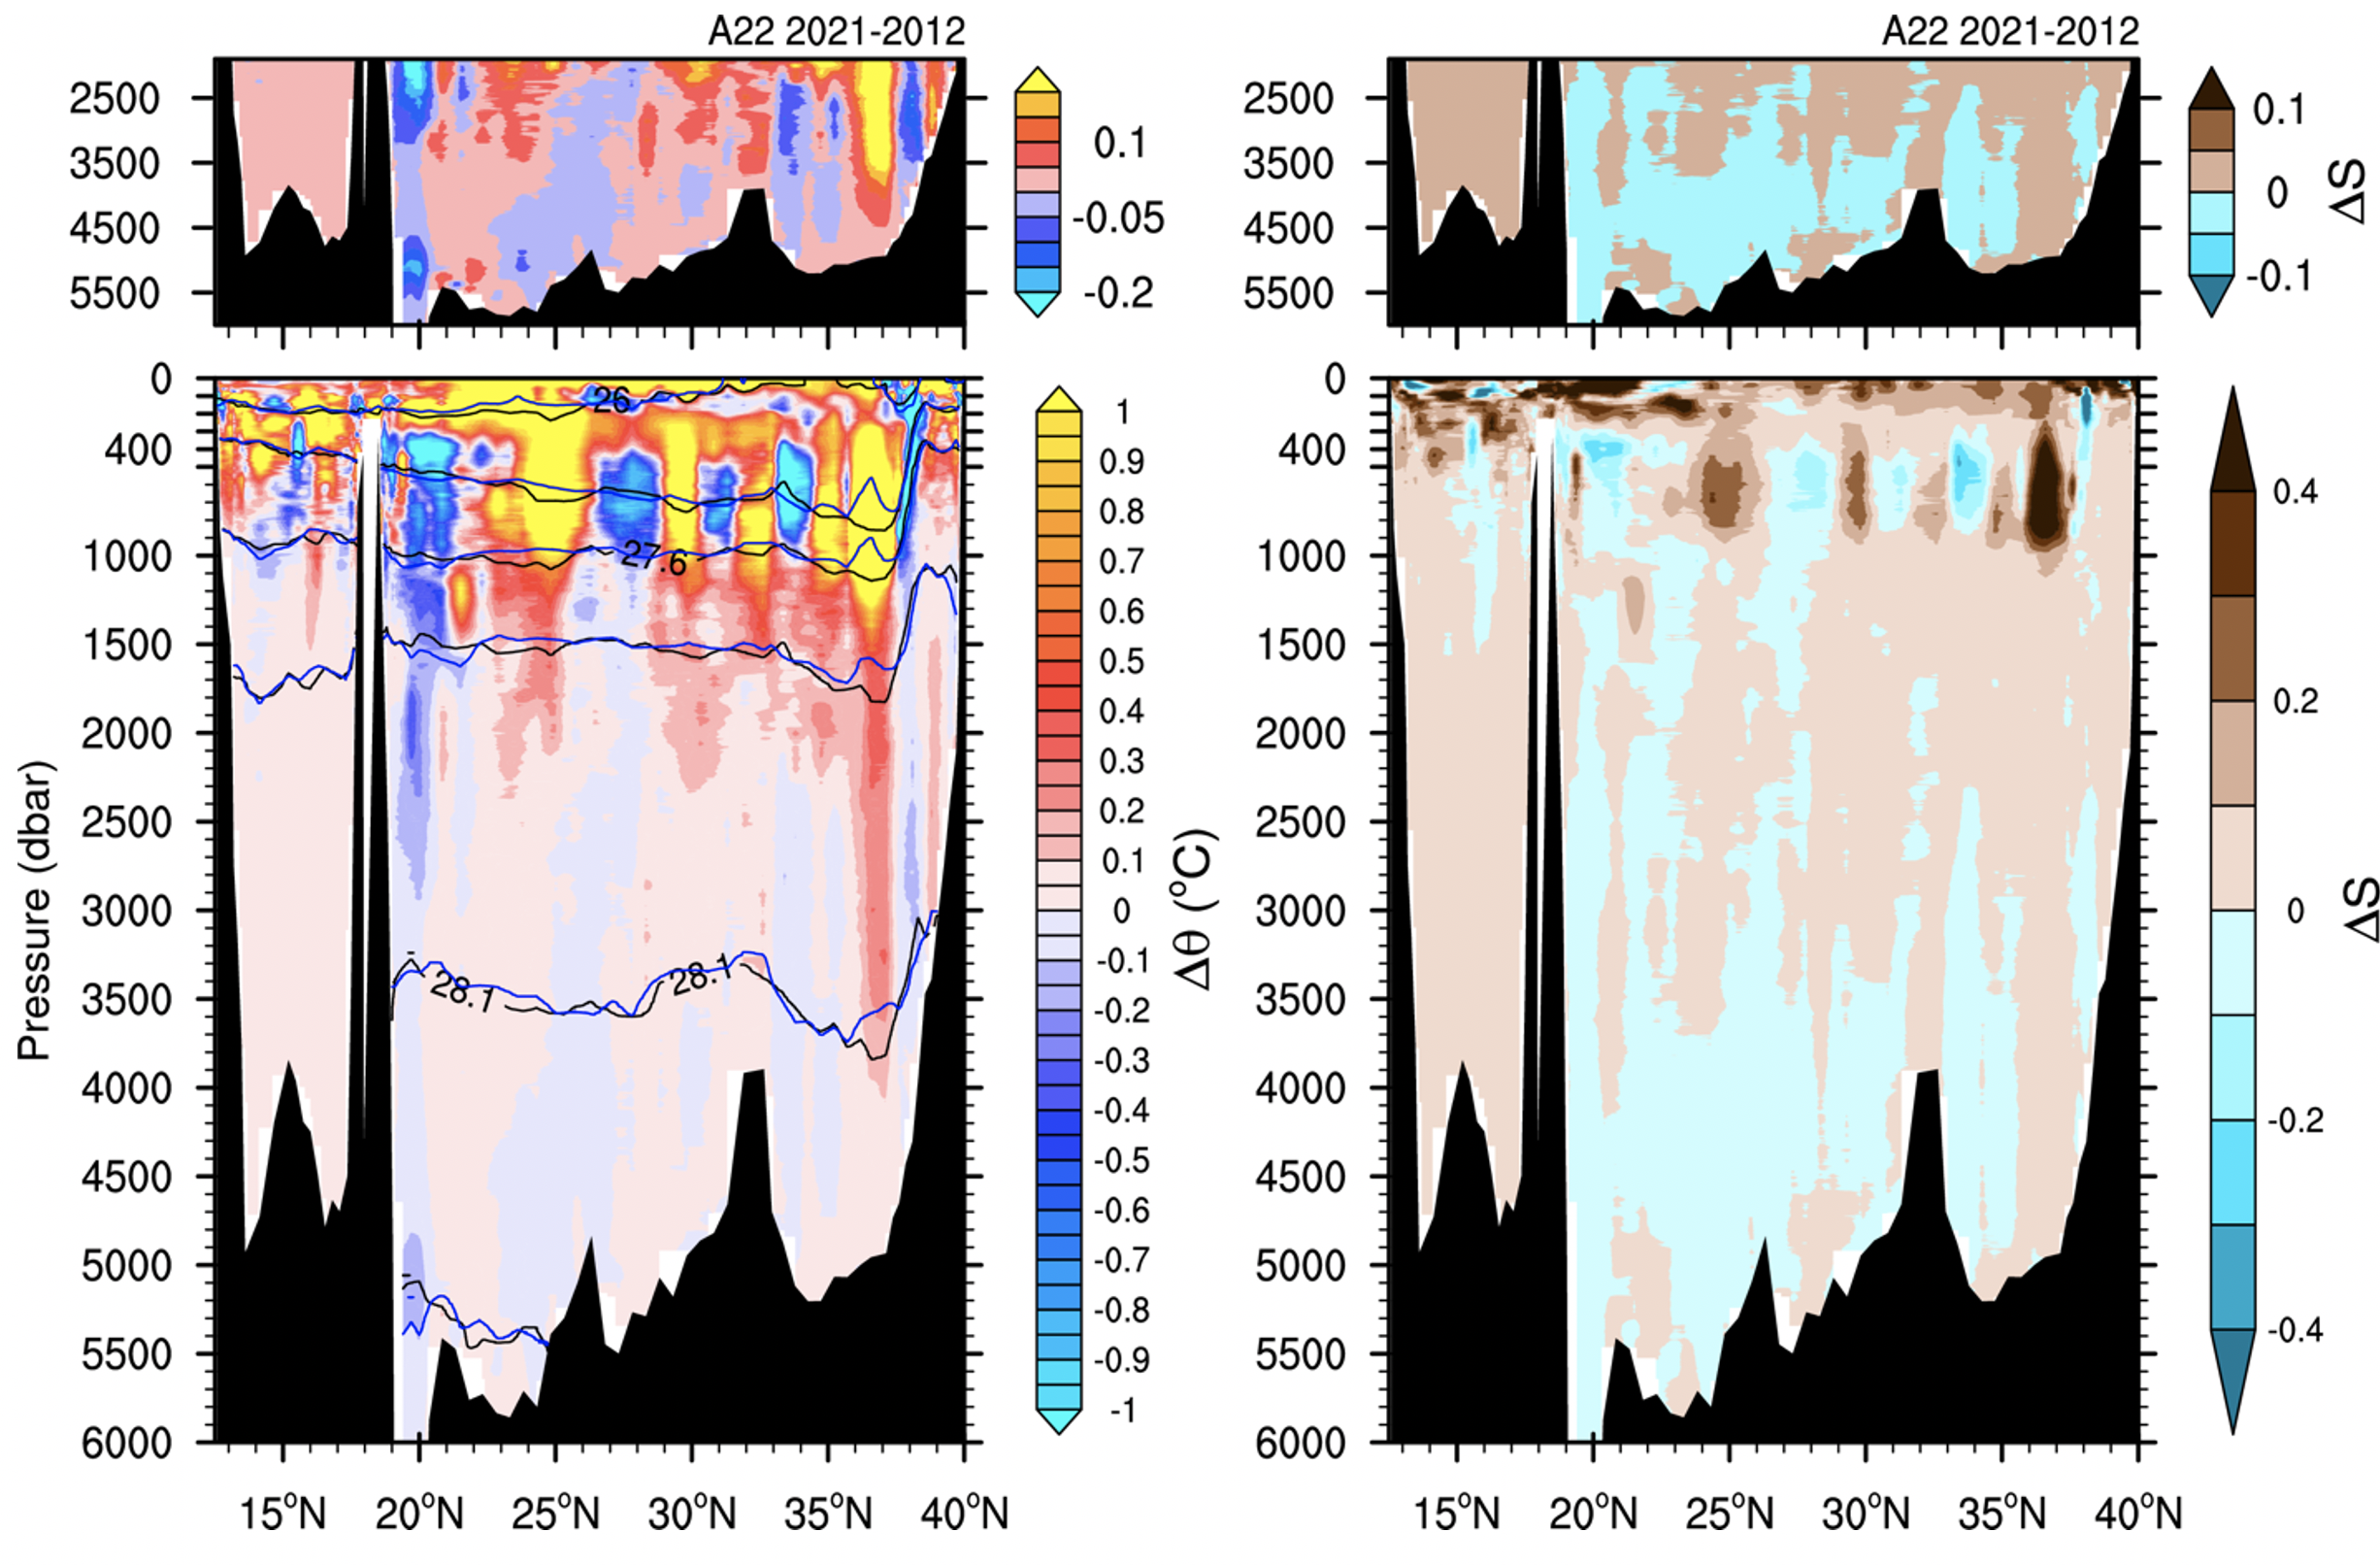
Difference in potential temperature (left) and salinity (right) between 2021 and 2012 A22 occupations. Contours are neutral density in 2021 (black) and 2012 (blue).
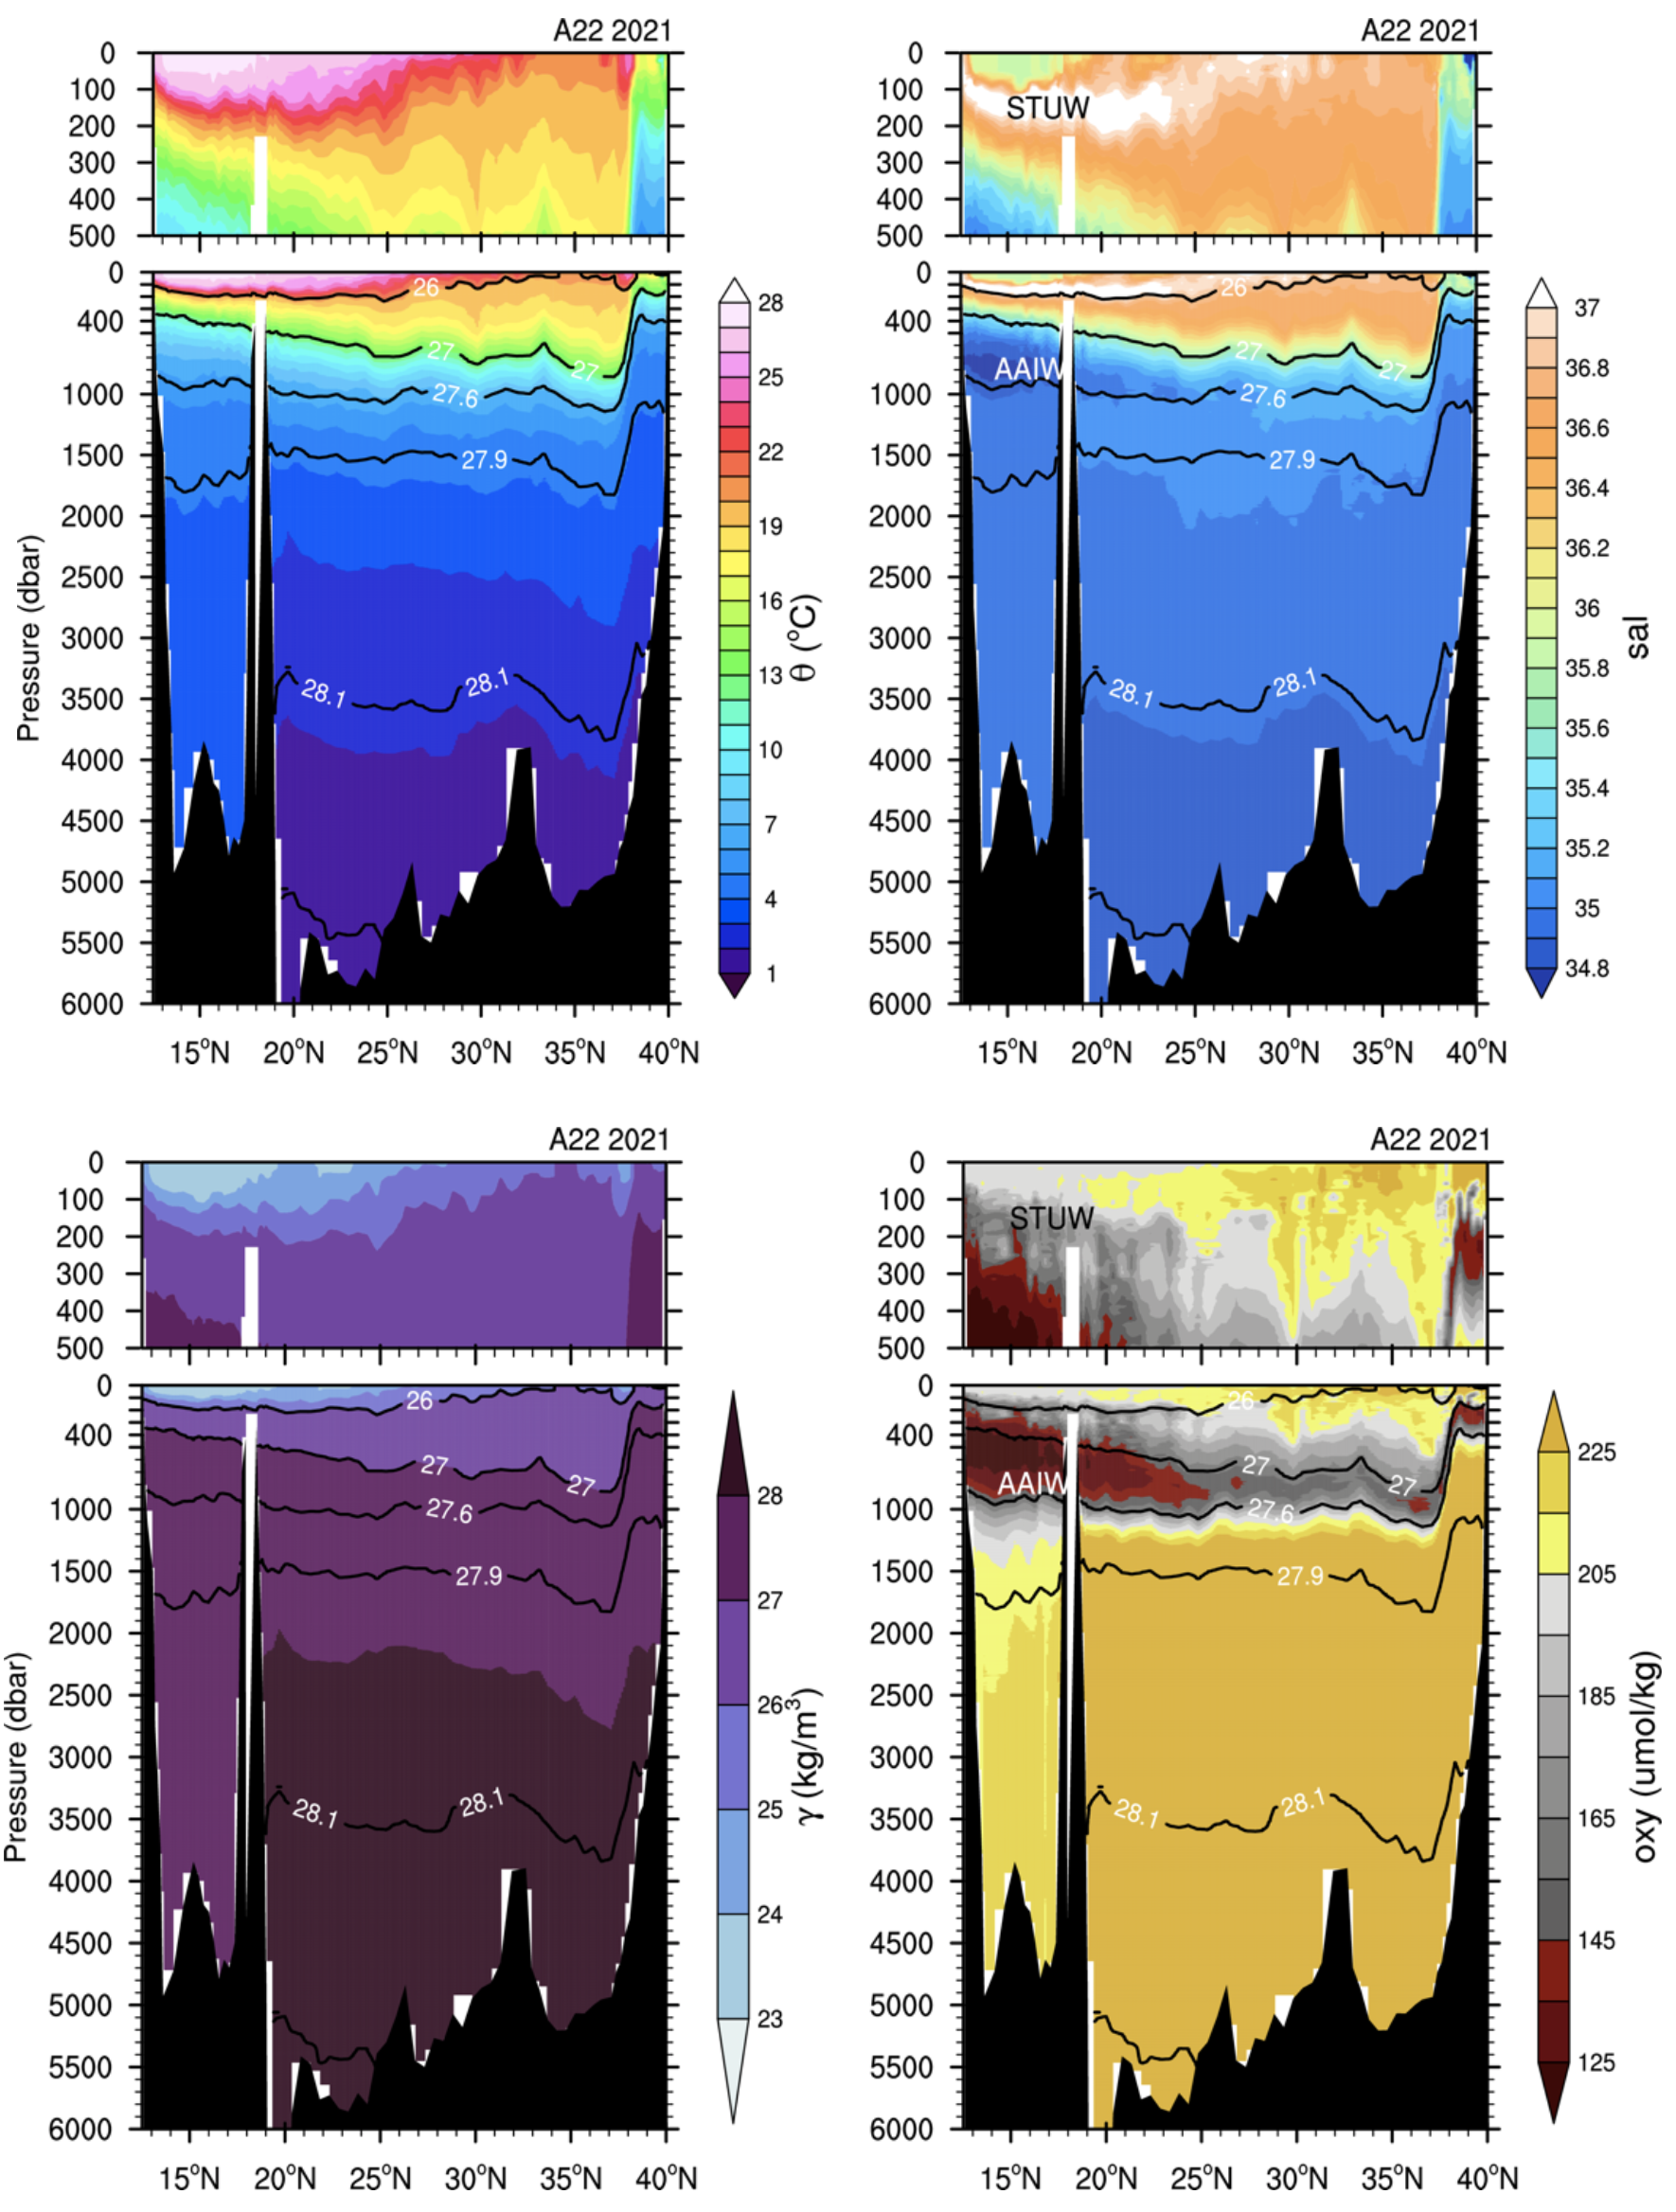
Potential temperature (upper left) and salinity (upper right) distributions at A22 2021 (stations 1-90) from CTD data. Same for neutral density (lower left) and dissolved oxygen (lower right). Contours are = 26, 27, 27.6, 27.9, 28.1, and 28.15 kg/m3.
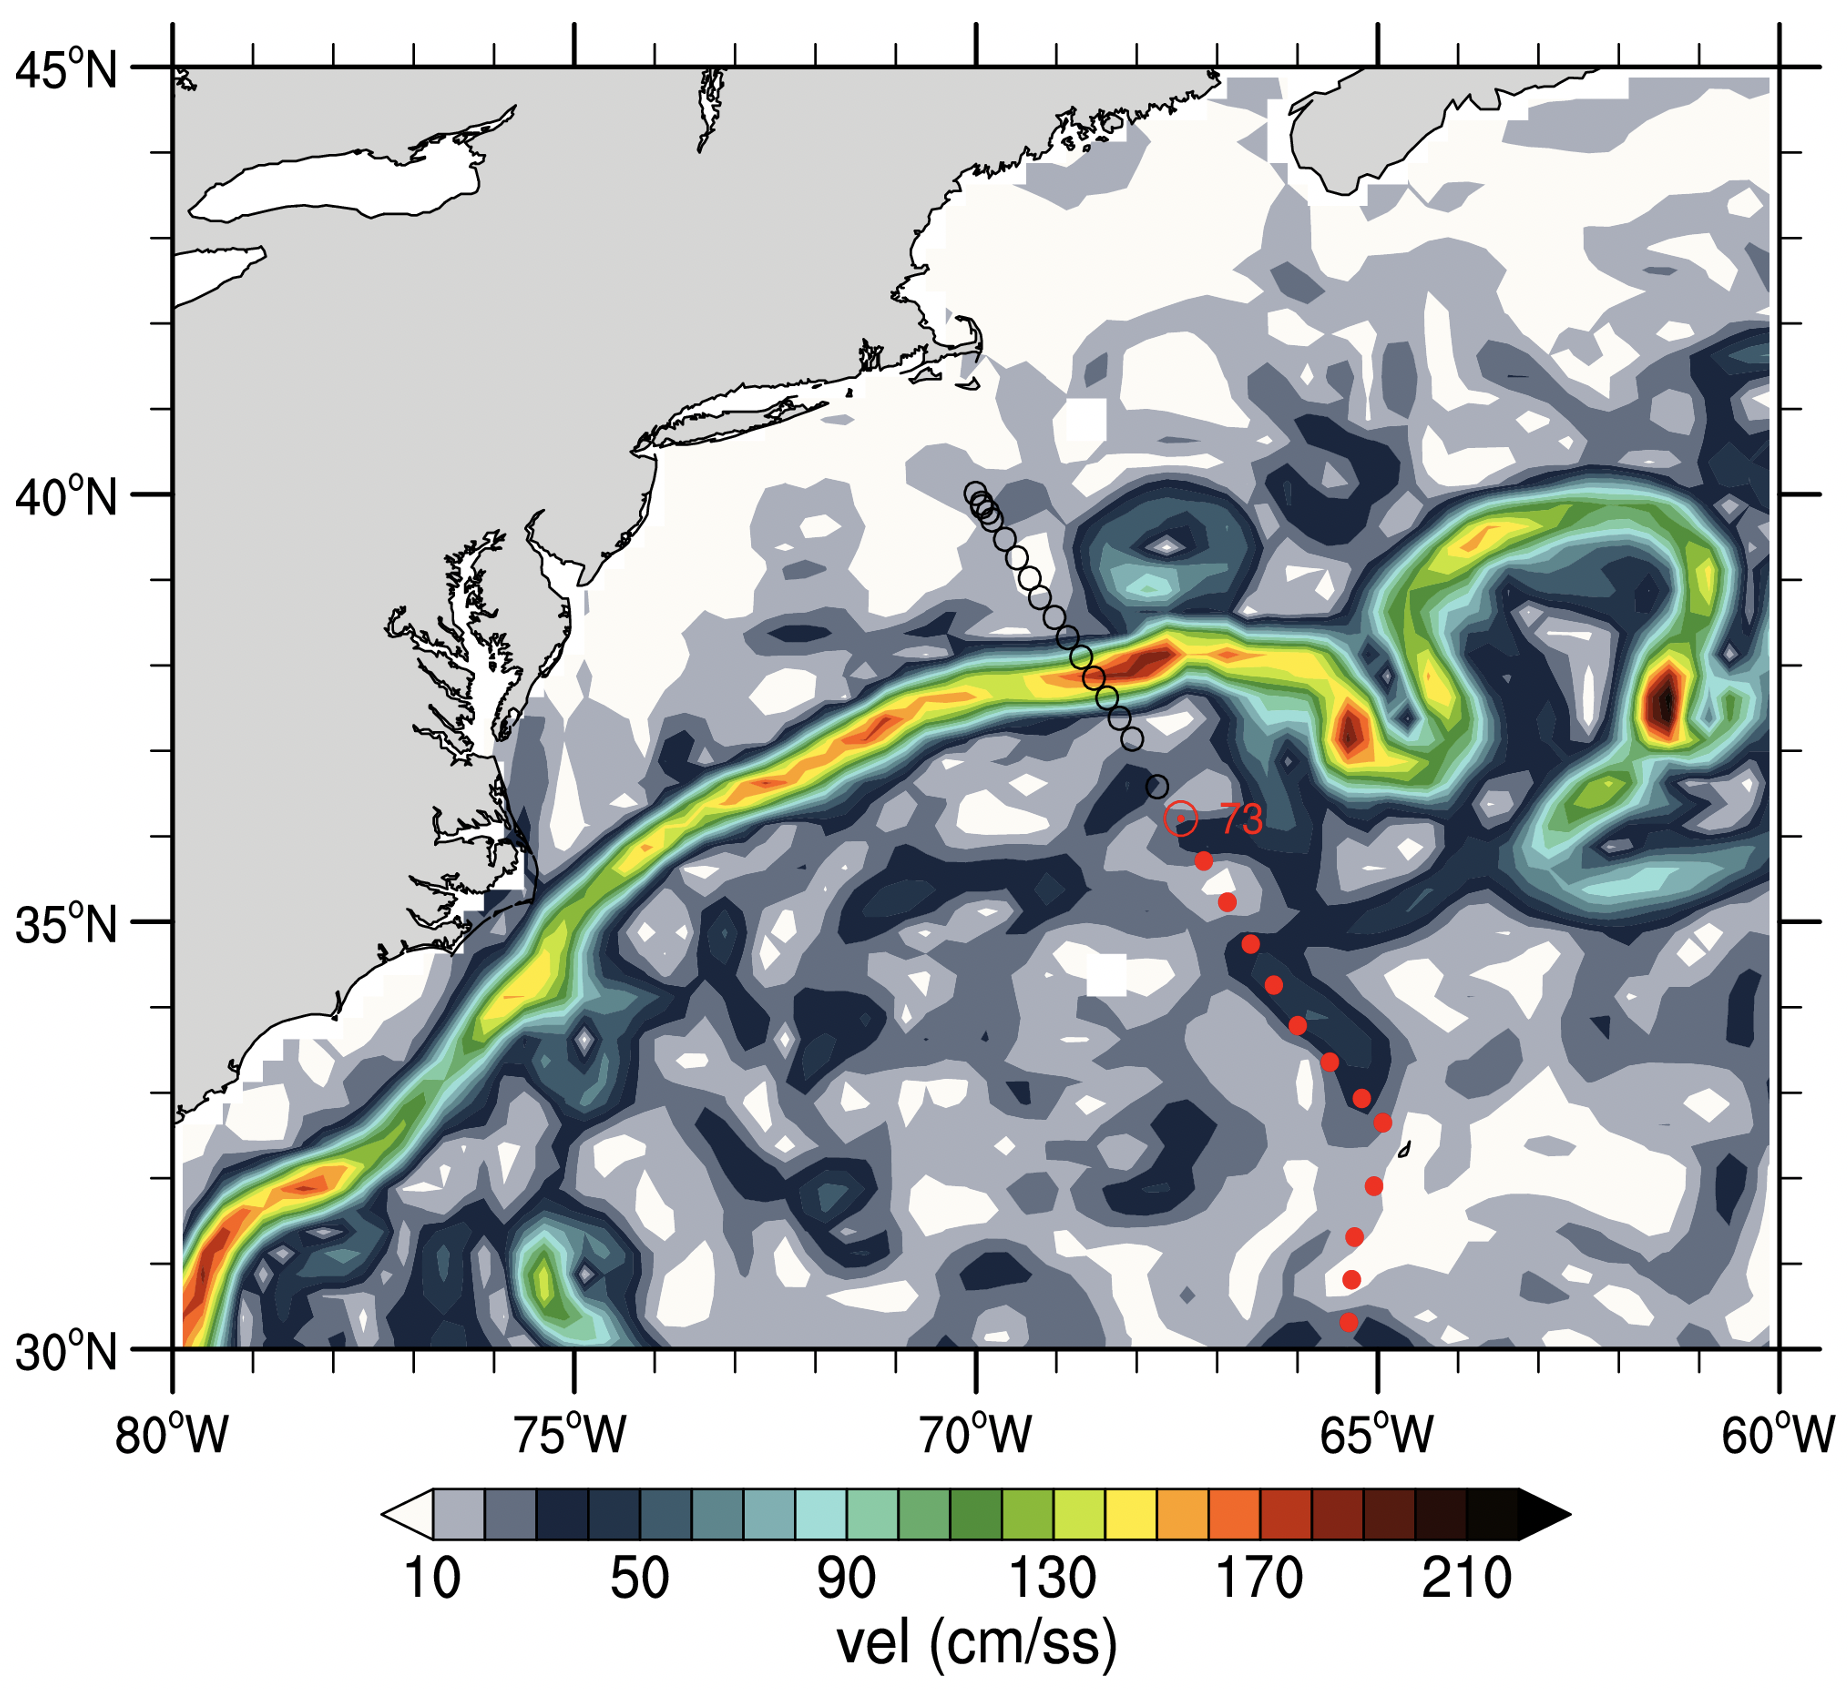
Geostrophic velocities for May 11 from satellite altimeters and A22 stations (dots).
- Joyce2001
Joyce, T. M., Hernandez‐Guerra, A., and Smethie, W. M. (2001), Zonal circulation in the NW Atlantic and Caribbean from a meridional World Ocean Circulation Experiment hydrographic section at 66°W, J. Geophys. Res., 106( C10), 22095– 22113, doi:10.1029/2000JC000268.